Steem API Health — Daily Report 2026-07-01
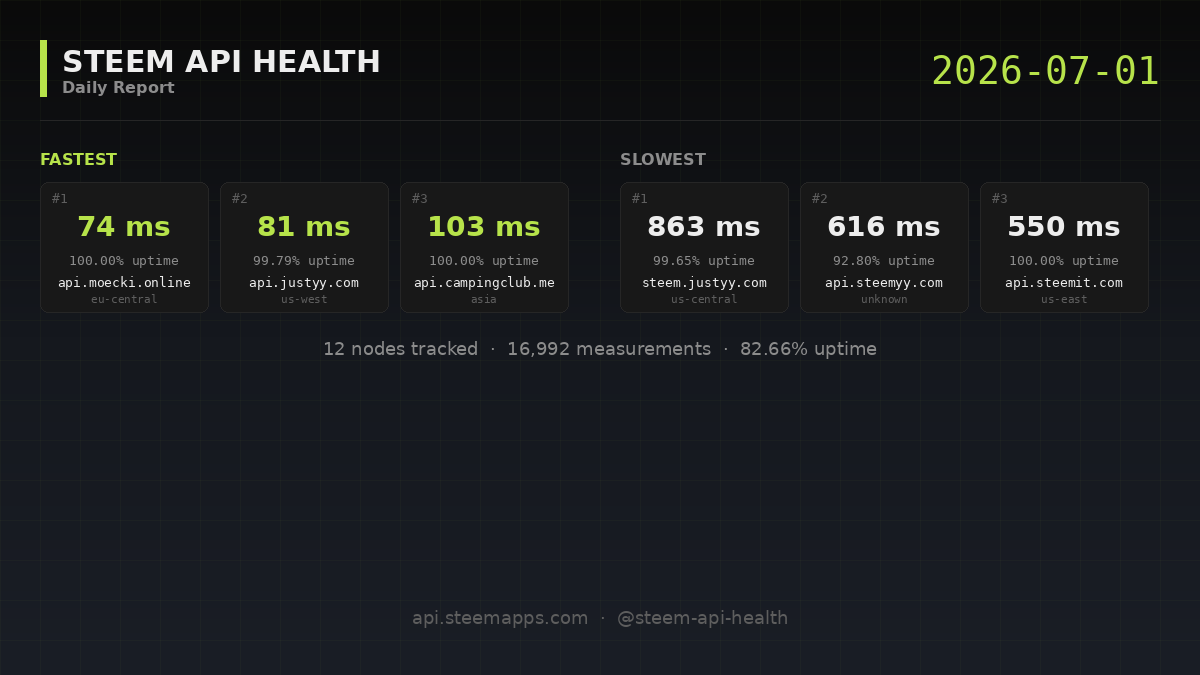
On 2026-07-01 (UTC) the monitor tracked 12 Steem API nodes with a global uptime of 82.66% across 16,992 measurements. Median latency across all nodes: 182 ms. Today's full picture and notable patterns below.
All measurements are taken from a single European location (Germany). Latency to nodes hosted outside Europe will naturally be higher than for users connecting from those regions. Want to contribute measurements from your region? See the participation block below.
Observations
- Longest outage today:
api.steem.fans, 1416 consecutive failed minutes. - Fastest node:
api.moecki.onlineat 74 ms average. That is 223 ms below the fleet average of 297 ms across 10 nodes. - Slowest node:
steem.justyy.comat 863 ms average. That is 566 ms above the fleet average of 297 ms. - Consistent leader:
api.justyy.comhas been in the top 3 by latency every day this week. - Consistent leader:
api.moecki.onlinehas been in the top 3 by latency every day this week. - Consistent laggard:
api.steemit.comhas been in the bottom 3 by latency every day this week. - Consistent laggard:
api.steemyy.comhas been in the bottom 3 by latency every day this week. - Consistent laggard:
steem.justyy.comhas been in the bottom 3 by latency every day this week.
Nodes
| Node | Region | Uptime | Avg | p50 | p95 | p99 | Errors | Error classes |
|---|---|---|---|---|---|---|---|---|
api.moecki.online | eu-central | 100.00 % | 74 ms | 70 ms | 98 ms | 150 ms | 0 | — |
api.campingclub.me | asia | 100.00 % | 103 ms | 99 ms | 143 ms | 167 ms | 0 | — |
steemd.steemworld.org | eu-central | 100.00 % | 111 ms | 110 ms | 122 ms | 134 ms | 0 | — |
steem.senior.workers.dev | global | 100.00 % | 210 ms | 205 ms | 307 ms | 377 ms | 0 | — |
api.steemit.com | us-east | 100.00 % | 550 ms | 547 ms | 716 ms | 859 ms | 0 | — |
api3.justyy.com | asia | 99.93 % | 175 ms | 142 ms | 250 ms | 496 ms | 1 | http_5xx ×1 |
api.justyy.com | us-west | 99.79 % | 81 ms | 73 ms | 98 ms | 188 ms | 3 | rpc_error ×3 |
api2.steemyy.com | global | 99.79 % | 189 ms | 161 ms | 311 ms | 626 ms | 3 | rpc_error ×3 |
steem.justyy.com | us-central | 99.65 % | 863 ms | 777 ms | 1309 ms | 3331 ms | 5 | connect_error ×5 |
api.steemyy.com | unknown | 92.80 % | 616 ms | 486 ms | 1429 ms | 2422 ms | 102 | connect_error ×2, http_4xx ×99, rpc_error ×1 |
api.steem.fans | asia | 0.00 % | — | — | — | — | 1416 | rpc_error ×1416 |
steemd.blazeapps.org | eu-central | 0.00 % | — | — | — | — | 1416 | http_5xx ×1416 |
Latency distribution
Across 14,046 successful measurements today: 60.0 % under 200 ms, 76.8 % under 500 ms, 97.6 % under 1 000 ms. (2.4 % were slower than 1 second.)
Time-of-day pattern
Best hour today: 07:00–08:00 UTC (avg latency 273 ms, 590 measurements). Worst hour: 13:00–14:00 UTC (avg latency 323 ms, 590 measurements).
Error pattern
Most common error today: rpc_error (48.3 %), followed by http_5xx (48.1 %), followed by http_4xx (3.4 %) (of 2,946 total errors).
Biggest outage of the day
api.steem.fans had a stretch of 1416 consecutive failed minutes today. Full per-tick view: node detail page.
Week over week
Week-over-week: current week 82.62 %, previous week 78.94 % (Δ +3.68 pp).
| Node | Δ uptime |
|---|---|
steem.justyy.com | -6.62 pp |
api.steemyy.com | -0.97 pp |
api.justyy.com | -0.04 pp |
steemd.blazeapps.org | ±0.00 pp |
api.steem.fans | ±0.00 pp |
api.moecki.online | ±0.00 pp |
steemd.steemworld.org | ±0.00 pp |
steem.senior.workers.dev | +0.01 pp |
api.steemit.com | +0.02 pp |
api3.justyy.com | +0.45 pp |
api2.steemyy.com | +0.45 pp |
api.campingclub.me | +50.85 pp |
Best vs worst performance gap
The fastest node was 11.66× faster than the slowest today (74 ms vs 863 ms). Last week the same factor was 20.45× — the gap is narrowing.
30-day reliability ranking
Most reliable
steemd.steemworld.org— 100.00 %
api.moecki.online— 99.97 %
api.steemit.com— 99.95 %
Least reliable
steemd.blazeapps.org— 0.00 %
api.steem.fans— 0.00 %
api.campingclub.me— 43.69 %
Longest unbroken uptime streak: steemd.steemworld.org — 22 days without a single failed tick.
Visual detail
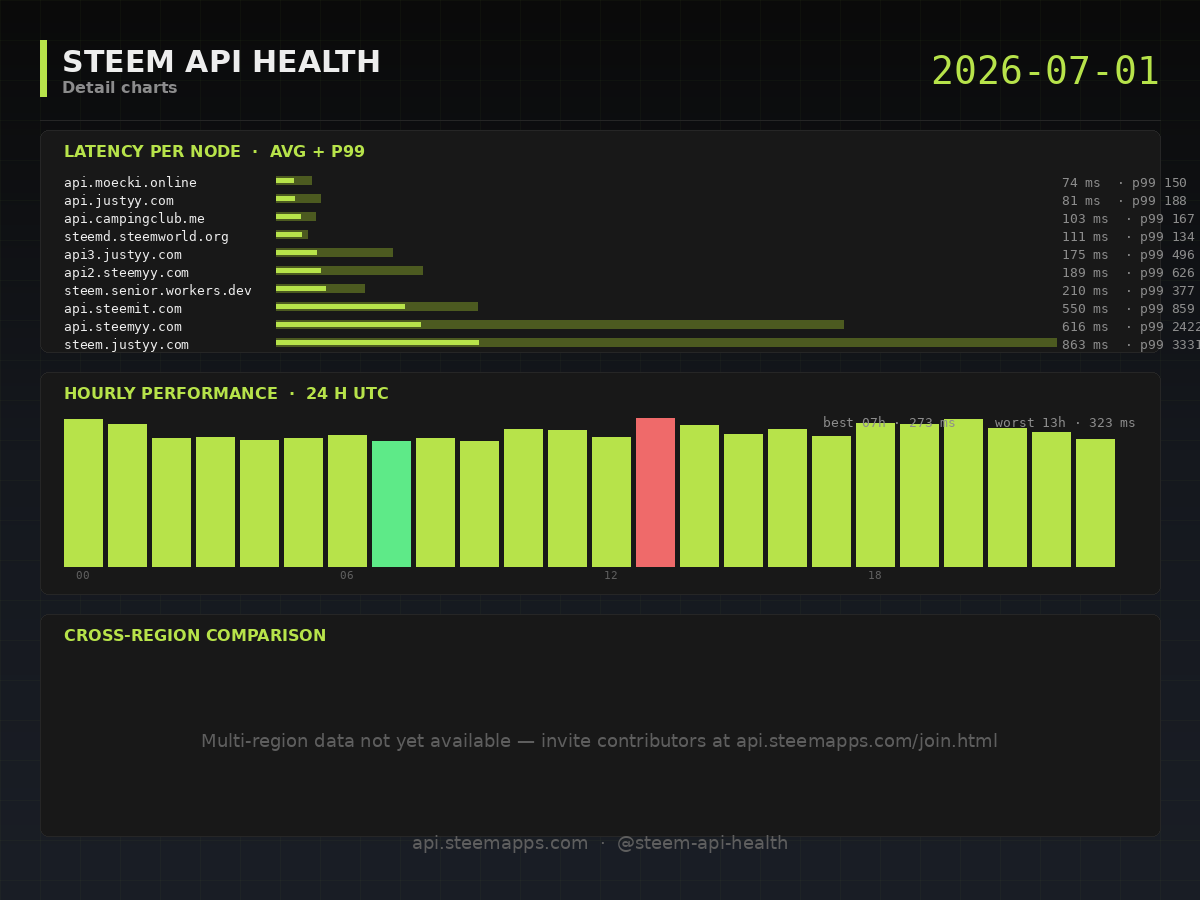
Top: latency distribution per node. Middle: hourly performance. Bottom: cross-region comparison (when multi-source data is available).
Methodology: one condenser_api.get_dynamic_global_properties request per node every 60 seconds, 8-second timeout. Full rules and thresholds in MEASUREMENT-METHODOLOGY.
Want to make these reports more accurate?
Anyone can contribute measurements from their own server. The participant script runs in Docker (3 commands to install) and helps build a global view of node performance.
- Participant script and instructions: https://github.com/greece-lover/steemapps-monitor/tree/main/participant
- Full participation guide: https://github.com/greece-lover/steemapps-monitor/blob/main/docs/PARTICIPATE.md
- Request an API key: visit https://api.steemapps.com/join.html — fully automated, takes about 2 minutes.
Contributors get attribution on the Sources page.
Feedback wanted
Have ideas for additional metrics, views, or analyses you'd like to see? Leave a comment below — the report format is still evolving and your input shapes future versions.
Resources
- Live dashboard: https://api.steemapps.com
- API documentation: https://github.com/greece-lover/steemapps-monitor/blob/main/docs/API.md
- Source code: https://github.com/greece-lover/steemapps-monitor
- Methodology: https://github.com/greece-lover/steemapps-monitor/blob/main/docs/MEASUREMENT-METHODOLOGY.md
- Raw data of this report:
custom_jsonoperationsteemapps_api_stats_daily, transaction12db8cf59c8c37209ae4ea6aaad2a97fb9858239in block24203 - Reporter account: @steem-api-health
- Operated by: @greece-lover (witness vote: https://steemitwallet.com/~witnesses)
Measurement window: 2026-07-01T00:00:00Z — 2026-07-02T00:00:00Z. Source location: contabo-de-1.