Steem API Health — Daily Report 2026-06-05
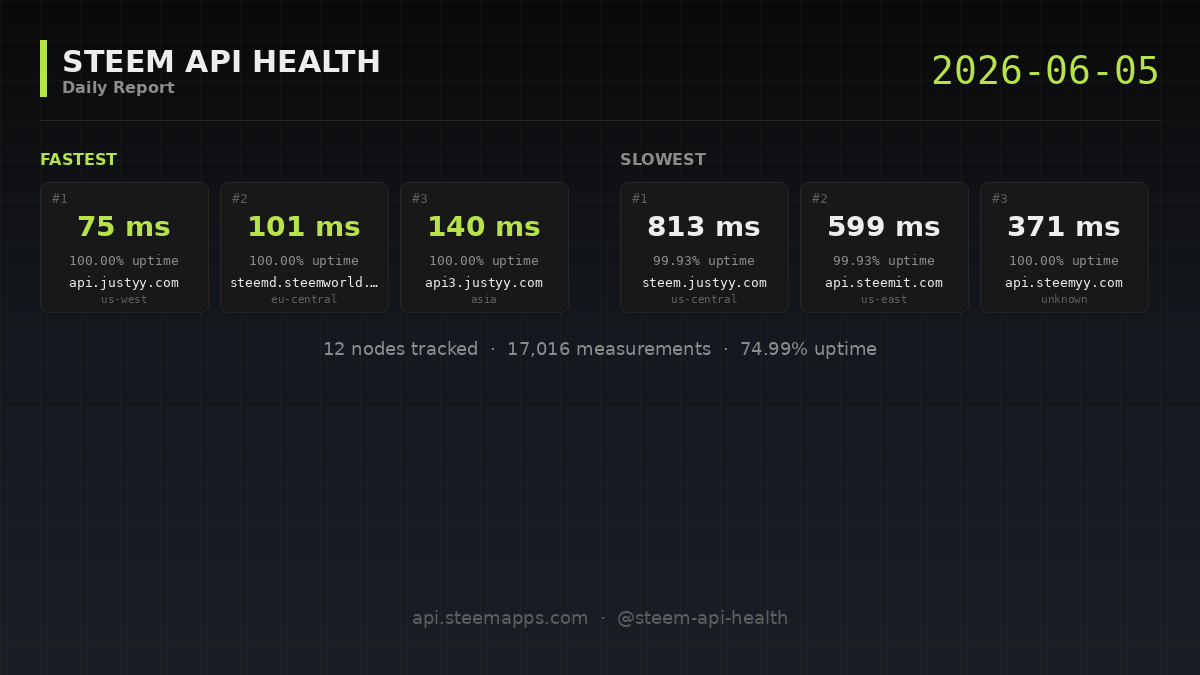
On 2026-06-05 (UTC) the monitor tracked 12 Steem API nodes with a global uptime of 74.99% across 17,016 measurements. Median latency across all nodes: 179 ms. Today's full picture and notable patterns below.
All measurements are taken from a single European location (Germany). Latency to nodes hosted outside Europe will naturally be higher than for users connecting from those regions. Want to contribute measurements from your region? See the participation block below.
Observations
- Longest outage today:
api.campingclub.me, 1418 consecutive failed minutes. - Fastest node:
api.justyy.comat 75 ms average. That is 221 ms below the fleet average of 296 ms across 9 nodes. - Slowest node:
steem.justyy.comat 813 ms average. That is 517 ms above the fleet average of 296 ms. - Consistent leader:
api.justyy.comhas been in the top 3 by latency every day this week. - Consistent leader:
api.moecki.onlinehas been in the top 3 by latency every day this week. - Consistent leader:
steemd.steemworld.orghas been in the top 3 by latency every day this week. - Consistent laggard:
api.steemit.comhas been in the bottom 3 by latency every day this week. - Consistent laggard:
steem.justyy.comhas been in the bottom 3 by latency every day this week.
Nodes
| Node | Region | Uptime | Avg | p50 | p95 | p99 | Errors | Error classes |
|---|---|---|---|---|---|---|---|---|
api.justyy.com | us-west | 100.00 % | 75 ms | 67 ms | 90 ms | 212 ms | 0 | — |
steemd.steemworld.org | eu-central | 100.00 % | 101 ms | 100 ms | 107 ms | 122 ms | 0 | — |
api3.justyy.com | asia | 100.00 % | 140 ms | 126 ms | 210 ms | 261 ms | 0 | — |
api.moecki.online | eu-central | 100.00 % | 153 ms | 131 ms | 374 ms | 382 ms | 0 | — |
api2.steemyy.com | global | 100.00 % | 179 ms | 173 ms | 293 ms | 356 ms | 0 | — |
steem.senior.workers.dev | global | 100.00 % | 232 ms | 208 ms | 419 ms | 509 ms | 0 | — |
api.steemyy.com | unknown | 100.00 % | 371 ms | 338 ms | 655 ms | 927 ms | 0 | — |
api.steemit.com | us-east | 99.93 % | 599 ms | 566 ms | 841 ms | 1279 ms | 1 | rpc_error ×1 |
steem.justyy.com | us-central | 99.93 % | 813 ms | 704 ms | 1290 ms | 3237 ms | 1 | rpc_error ×1 |
api.campingclub.me | asia | 0.00 % | — | — | — | — | 1418 | http_5xx ×1418 |
api.steem.fans | asia | 0.00 % | — | — | — | — | 1418 | rpc_error ×1418 |
steemd.blazeapps.org | eu-central | 0.00 % | — | — | — | — | 1418 | http_5xx ×1416, timeout ×2 |
Latency distribution
Across 12,760 successful measurements today: 55.1 % under 200 ms, 76.2 % under 500 ms, 98.4 % under 1 000 ms. (1.6 % were slower than 1 second.)
Time-of-day pattern
Best hour today: 22:00–23:00 UTC (avg latency 260 ms, 531 measurements). Worst hour: 12:00–13:00 UTC (avg latency 346 ms, 531 measurements).
Error pattern
Most common error today: http_5xx (66.6 %), followed by rpc_error (33.4 %), followed by timeout (0.0 %) (of 4,256 total errors).
Biggest outage of the day
api.campingclub.me had a stretch of 1418 consecutive failed minutes today. Full per-tick view: node detail page.
Week over week
Week-over-week: current week 81.00 %, previous week 85.28 % (Δ -4.28 pp).
| Node | Δ uptime |
|---|---|
api.steem.fans | -36.47 pp |
api.campingclub.me | -19.09 pp |
steem.senior.workers.dev | -0.06 pp |
api.moecki.online | -0.06 pp |
api2.steemyy.com | -0.05 pp |
api3.justyy.com | -0.05 pp |
api.justyy.com | ±0.00 pp |
steemd.steemworld.org | ±0.00 pp |
steemd.blazeapps.org | ±0.00 pp |
api.steemit.com | +0.08 pp |
api.steemyy.com | +0.60 pp |
steem.justyy.com | +3.69 pp |
Best vs worst performance gap
The fastest node was 10.84× faster than the slowest today (75 ms vs 813 ms). Last week the same factor was 8.90× — the gap is widening.
30-day reliability ranking
Most reliable
steemd.steemworld.org— 99.99 %
api.moecki.online— 99.97 %
steem.senior.workers.dev— 99.95 %
Least reliable
steemd.blazeapps.org— 11.07 %
api.steem.fans— 61.17 %
api.campingclub.me— 94.73 %
Longest unbroken uptime streak: steemd.steemworld.org — 21 days without a single failed tick.
Visual detail
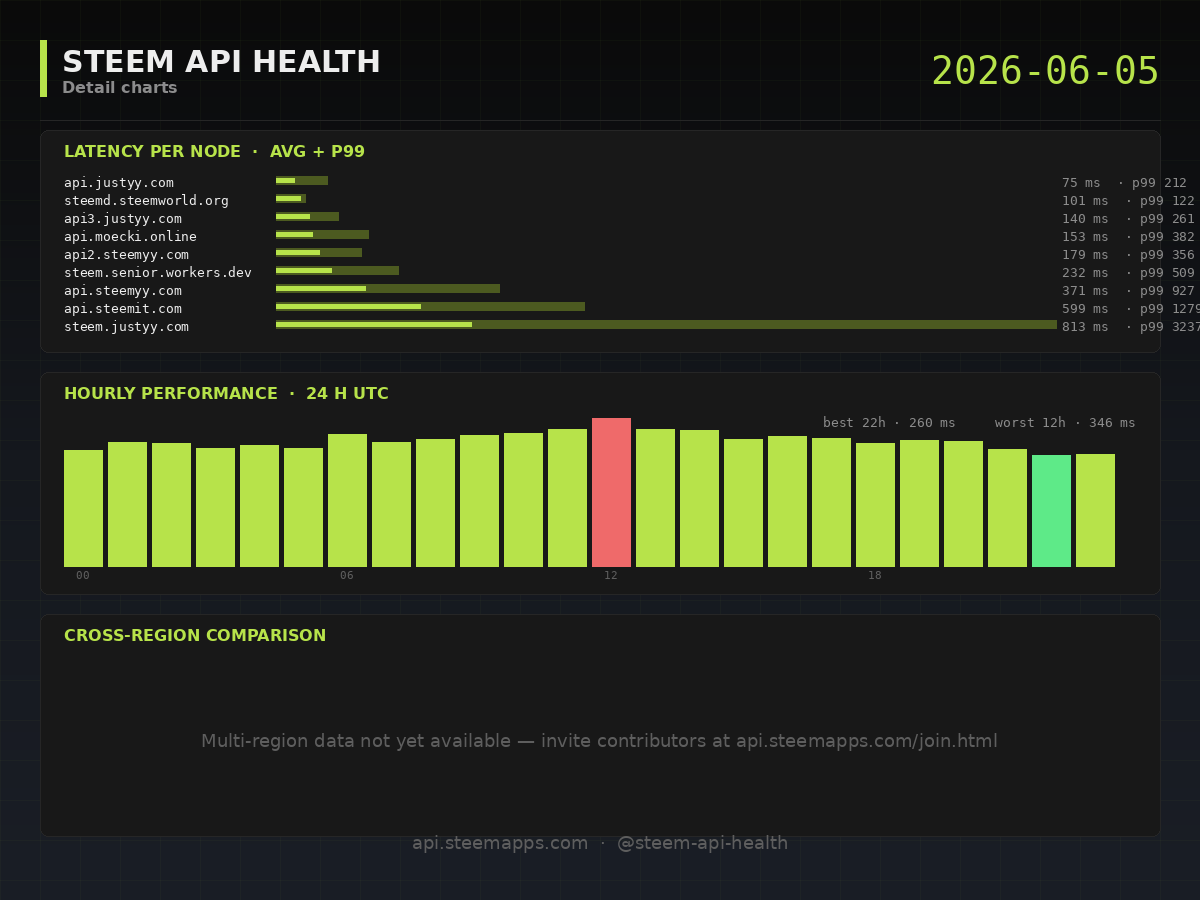
Top: latency distribution per node. Middle: hourly performance. Bottom: cross-region comparison (when multi-source data is available).
Methodology: one condenser_api.get_dynamic_global_properties request per node every 60 seconds, 8-second timeout. Full rules and thresholds in MEASUREMENT-METHODOLOGY.
Want to make these reports more accurate?
Anyone can contribute measurements from their own server. The participant script runs in Docker (3 commands to install) and helps build a global view of node performance.
- Participant script and instructions: https://github.com/greece-lover/steemapps-monitor/tree/main/participant
- Full participation guide: https://github.com/greece-lover/steemapps-monitor/blob/main/docs/PARTICIPATE.md
- Request an API key: visit https://api.steemapps.com/join.html — fully automated, takes about 2 minutes.
Contributors get attribution on the Sources page.
Feedback wanted
Have ideas for additional metrics, views, or analyses you'd like to see? Leave a comment below — the report format is still evolving and your input shapes future versions.
Resources
- Live dashboard: https://api.steemapps.com
- API documentation: https://github.com/greece-lover/steemapps-monitor/blob/main/docs/API.md
- Source code: https://github.com/greece-lover/steemapps-monitor
- Methodology: https://github.com/greece-lover/steemapps-monitor/blob/main/docs/MEASUREMENT-METHODOLOGY.md
- Raw data of this report:
custom_jsonoperationsteemapps_api_stats_daily, transaction1bf97449fb91bb8cabd9061f75a1ee0b5d976214in block63986 - Reporter account: @steem-api-health
- Operated by: @greece-lover (witness vote: https://steemitwallet.com/~witnesses)
Measurement window: 2026-06-05T00:00:00Z — 2026-06-06T00:00:00Z. Source location: contabo-de-1.