Dubai Real Estate Rental Transactions: 3rd Week May 2026
Dubai Real Estate Rental Transactions Report
Dubai Real Estate Registry Statistics
Third Week of May 2026 (16 – 23 May)
During the third week of May 2026, Dubai recorded 23,127 real estate rental transactions with a total registered value of AED 30,019,831,701 (USD 8,174,220,053.19).
Renewed contracts accounted for the larger share of transaction volume, while new contracts represented the majority of registered value. Residential properties remained the dominant usage category by both volume and value.
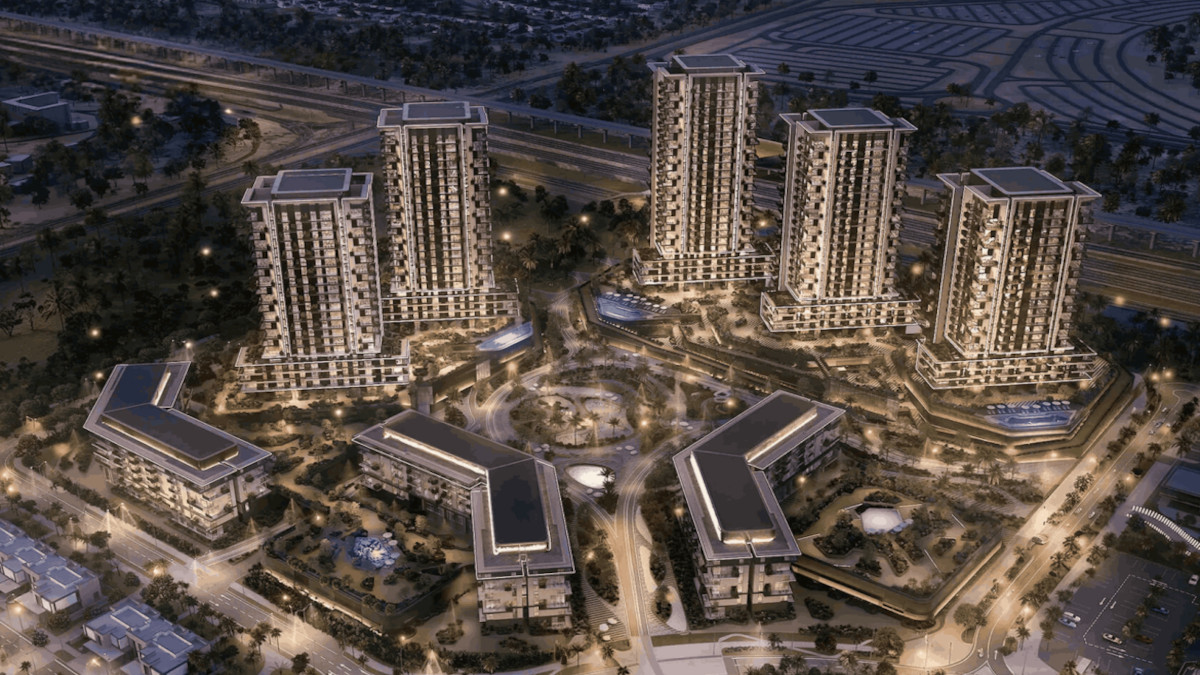
Rise by Athlon by Aldar Community Night View, Dubai
Source: Building Arabia.
Transactions by Contract Type
| Category | Number of Transactions | Value (AED) | Value (USD) |
|---|---|---|---|
| New | 9914 | 25,618,592,979 | 6,976,502,093.38 |
| Renewed | 13213 | 4,401,238,722 | 1,197,717,959.81 |
| Grand Total | 23127 | 30,019,831,701 | 8,174,220,053.19 |
Transactions by Property Ownership
| Category | Number of Transactions | Value (AED) | Value (USD) |
|---|---|---|---|
| Free Hold | 11854 | 24,393,943,288 | 6,642,286,731.87 |
| Non Free Hold | 11273 | 5,625,888,413 | 1,531,933,048.59 |
| Grand Total | 23127 | 30,019,831,701 | 8,174,220,053.19 |
Transactions by Property Usage
| Category | Number of Transactions | Value (AED) | Value (USD) |
|---|---|---|---|
| Commercial | 5649 | 1,435,751,641 | 391,016,559.98 |
| Educational facility | 3 | 4,184,584 | 1,139,431.12 |
| Health Facility | 3 | 104,421 | 28,432.88 |
| Industrial | 42 | 11,532,850 | 3,140,000.90 |
| Residential | 17345 | 28,550,572,240 | 7,774,083,839.37 |
| Storage | 2 | 32,000 | 8,713.41 |
| Other | 83 | 17,653,966 | 4,803,075.54 |
| Grand Total | 23127 | 30,019,831,701 | 8,174,220,053.19 |
Transactions by Property Type
| Category | Number of Transactions | Value (AED) | Value (USD) |
|---|---|---|---|
| A) Building | |||
| Factory | 2 | 3,168,855 | 862,779 |
| Subtotal | 2 | 3,168,855 | 862,779 |
| B) Land | |||
| Other | 65 | 15,874,176 | 4,321,003 |
| Subtotal | 65 | 15,874,176 | 4,321,003 |
| C) Unit | |||
| ATM | 1 | 34,729 | 9,456 |
| Building | 4 | 214,534 | 58,413 |
| Clinic | 1 | 140,000 | 38,121 |
| Complex Warehouse | 5 | 1,151,675 | 313,565 |
| Factory | 2 | 200,000 | 54,459 |
| Flat | 13363 | 23,828,389,906 | 6,488,019,199 |
| GYM | 2 | 972,600 | 264,821 |
| Health club | 1 | 20,834 | 5,673 |
| Hotel | 84 | 27,156,398 | 7,395,196 |
| Kiosk | 10 | 922,478 | 251,170 |
| Labor Camps | 2310 | 4,333,530,243 | 1,179,971,587 |
| Ladies Saloon | 3 | 432,000 | 117,631 |
| Medical center | 1 | 46,027 | 12,533 |
| Mezzanine | 6 | 2,015,737 | 548,799 |
| Nursery | 1 | 1,039,765 | 283,104 |
| Office | 2271 | 566,586,052 | 154,266,078 |
| Open space | 5 | 3,320,903 | 904,214 |
| Parking | 3 | 468,000 | 127,434 |
| Pharmacy | 1 | 240,000 | 65,351 |
| Restaurant | 11 | 8,218,030 | 2,237,645 |
| Restuaunts Complex | 1 | 160,000 | 43,567 |
| School | 3 | 4,184,584 | 1,139,431 |
| Shop | 1712 | 554,088,771 | 150,856,996 |
| Showroom | 74 | 20,012,932 | 5,449,171 |
| Staff Accommodation | 9 | 488,000 | 132,879 |
| Storage | 1 | 10,500 | 2,859 |
| Store | 13 | 5,651,656 | 1,538,729 |
| Studio | 155 | 6,005,663 | 1,635,124 |
| Supermarket | 3 | 5,775,631 | 1,572,467 |
| Supermarket, a multi-section | 5 | 1,876,539 | 510,880 |
| Villa | 1 | 50,000 | 13,615 |
| Warehouse | 262 | 110,548,468 | 30,099,519 |
| Warehouse complex | 7 | 1,090,839 | 296,998 |
| Workshop | 38 | 5,845,622 | 1,591,526 |
| Other | 14 | 1,827,826 | 497,585 |
| Subtotal | 20383 | 29,492,716,941 | 8,031,331,112 |
| D) Villa | |||
| Clinic | 3 | 2,782,328 | 757,516 |
| Complex Villas | 123 | 21,641,472 | 5,891,834 |
| Hospital | 2 | 2,400,000 | 653,506 |
| Medical center | 1 | 525,000 | 142,954 |
| Office | 1 | 60,000 | 16,338 |
| Shop | 5 | 6,946,000 | 1,891,155 |
| Villa | 1419 | 375,871,308 | 102,449,806 |
| Subtotal | 1554 | 410,226,108 | 111,803,108 |
| E) Virtual Unit | |||
| kitchen | 1 | 151,000 | 41,116 |
| Office | 1105 | 71,437,185 | 19,450,795 |
| Shop | 14 | 26,172,435 | 7,126,178 |
| Warehouse | 3 | 85,000 | 23,145 |
| Subtotal | 1123 | 97,845,620 | 26,641,234 |
| Grand Total | 23127 | 30,019,831,701 | 8,174,220,053 |
Top 10 Localities by Value
| Category | Number of Transactions | Value (AED) | Value (USD) |
|---|---|---|---|
| Al Yelayiss 2 | 381 | 21,694,768,789 | 5,907,206,786.85 |
| Jabal Ali Industrial First | 770 | 2,178,041,696 | 593,040,202.48 |
| Me'Aisem First | 438 | 761,756,931 | 207,417,666.88 |
| Al Goze Third | 493 | 710,604,938 | 193,487,526.88 |
| Al Goze Industrial Fourth | 180 | 635,959,688 | 173,168,784.42 |
| Madinat Al Mataar | 319 | 466,851,373 | 127,112,454.58 |
| Al Nahda Second | 501 | 239,599,773 | 65,235,981.39 |
| Burj Khalifa | 451 | 212,041,642 | 57,740,751.95 |
| Business Bay | 1252 | 172,151,801 | 46,873,346.87 |
| Al Goze Industrial Second | 487 | 148,419,177 | 40,414,142.53 |
There were 128 other active localities with a combined transaction value of AED 2,799,635,893 (USD 762,522,408.36). Examples from the next highest locations include Al Thanyah First, Al Thanyah Fifth, and Dubai Investment Park Second.
The registered figures show rental activity distributed across a broad range of residential, commercial, industrial, and specialized property categories. Flat rentals represented the largest segment by volume and value during the reporting period.
These statistics reflect recorded rental transactions registered during the third week of May 2026.
Disclaimer
This report is based on publicly available market transaction summaries and compiled data related to Dubai real estate activity for the stated period.
Figures are presented for informational purposes only and may vary from final official statistics published by the Dubai Land Department (DLD).
1 US Dollar = 3.6725 UAE Dirhams
This material does not constitute financial or investment advice. Real estate investments involve risk and readers should conduct independent research before making any investment decisions.