Dubai Real Estate Rental Transactions: 20 May 2026
Dubai Real Estate Rental Transactions Report
20 May 2026
Dubai registered 3,966 real estate rental transactions on 20 May 2026 with a total recorded value of AED1,133,888,677.
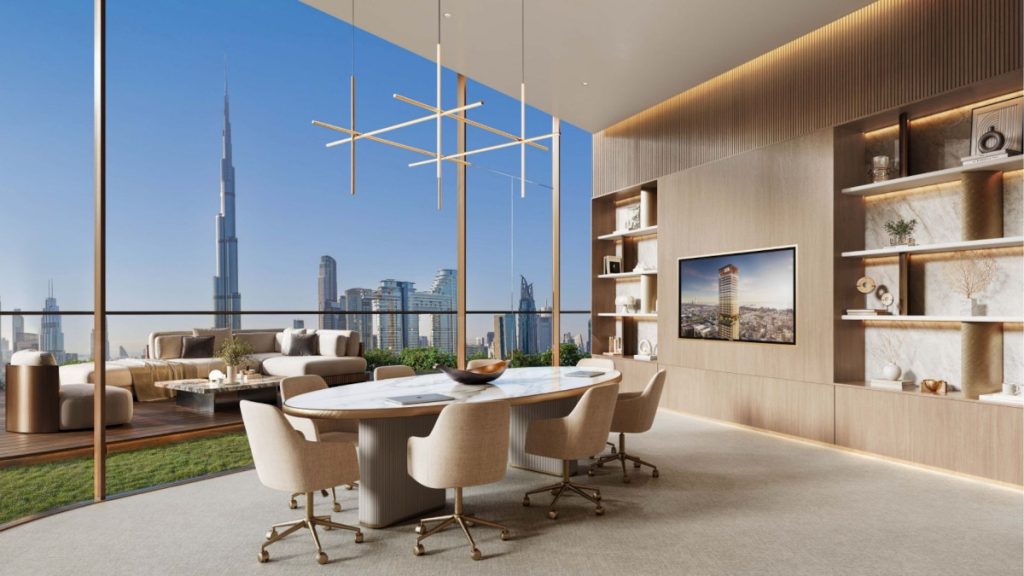
SOL LUXE – Residences & Offices on Sheikh Zayed Road, Dubai - Developed by SOL Properties
Source: Building Arabia.
Transactions by Contract Type
| Category | Number of Transactions | Value (AED) | Value (USD) |
|---|---|---|---|
| New | 1712 | 490,274,020 | 133,484,006 |
| Renewed | 2254 | 643,614,657 | 175,233,061 |
| Grand Total | 3966 | 1,133,888,677 | 308,717,067 |
Transactions by Property Ownership
| Category | Number of Transactions | Value (AED) | Value (USD) |
|---|---|---|---|
| Free Hold | 1853 | 343,656,751 | 93,565,352 |
| Non Free Hold | 2113 | 790,231,926 | 215,151,715 |
| Grand Total | 3966 | 1,133,888,677 | 308,717,067 |
Transactions by Property Usage
| Category | Number of Transactions | Value (AED) | Value (USD) |
|---|---|---|---|
| Commercial | 995 | 267,723,516 | 72,891,455 |
| Educational facility | 1 | 281,894 | 76,749 |
| Health Facility | 1 | 37,560 | 10,226 |
| Industrial | 9 | 2,300,409 | 626,319 |
| Residential | 2945 | 861,354,805 | 234,515,802 |
| Other | 15 | 2,190,493 | 596,515 |
| Grand Total | 3966 | 1,133,888,677 | 308,717,067 |
Transactions by Property Type
| Category | Number of Transactions | Value (AED) | Value (USD) |
|---|---|---|---|
| A) Land | |||
| Other | 12 | 1,613,921 | 439,413 |
| Subtotal | 12 | 1,613,921 | 439,413 |
| B) Unit | |||
| ATM | 1 | 34,729 | 9,455 |
| Building | 1 | 37,500 | 10,210 |
| Complex Warehouse | 3 | 915,880 | 249,361 |
| Flat | 2125 | 207,836,357 | 56,586,362 |
| Hotel | 13 | 2,165,000 | 589,452 |
| Kiosk | 3 | 342,375 | 93,216 |
| Labor Camps | 503 | 575,141,537 | 156,590,335 |
| Mezzanine | 1 | 20,000 | 5,445 |
| Nursery | 1 | 1,039,765 | 283,091 |
| Office | 426 | 136,836,538 | 37,255,471 |
| Open space | 1 | 1,039,765 | 283,091 |
| Parking | 1 | 130,000 | 35,394 |
| Restaurant | 3 | 825,304 | 224,701 |
| School | 1 | 281,894 | 76,749 |
| Shop | 278 | 80,970,040 | 22,045,227 |
| Showroom | 15 | 2,050,397 | 558,249 |
| Store | 3 | 670,000 | 182,417 |
| Studio | 41 | 1,398,079 | 380,647 |
| Warehouse | 52 | 32,256,014 | 8,782,148 |
| Warehouse complex | 3 | 420,700 | 114,541 |
| Other | 5 | 806,000 | 219,445 |
| Subtotal | 3480 | 1,045,217,874 | 284,575,227 |
| C) Villa | |||
| Clinic | 1 | 300,000 | 81,679 |
| Complex Villas | 17 | 3,180,711 | 865,993 |
| Shop | 2 | 175,000 | 47,646 |
| Villa | 265 | 75,863,593 | 20,654,923 |
| Subtotal | 285 | 79,519,304 | 21,650,241 |
| D) Virtual Unit | |||
| kitchen | 1 | 151,000 | 41,112 |
| Office | 185 | 5,697,244 | 1,551,155 |
| Shop | 2 | 1,644,334 | 447,693 |
| Warehouse | 1 | 45,000 | 12,252 |
| Subtotal | 189 | 7,537,578 | 2,052,186 |
| Grand Total | 3966 | 1,133,888,677 | 308,717,067 |
Top 10 Localities by Value
| Category | Number of Transactions | Value (AED) | Value (USD) |
|---|---|---|---|
| Jabal Ali Industrial First | 308 | 495,929,799 | 135,023,831 |
| Al Thanyah First | 32 | 84,689,156 | 23,057,013 |
| Al Karama | 92 | 52,382,363 | 14,261,829 |
| Um Ramool | 94 | 50,746,483 | 13,816,442 |
| Business Bay | 237 | 34,038,514 | 9,267,462 |
| Saih Shuaib 4 | 15 | 25,952,320 | 7,065,884 |
| Al Goze Industrial Second | 86 | 22,777,163 | 6,201,301 |
| Al Khairan First | 96 | 22,495,857 | 6,124,715 |
| Al Thanayah Fourth | 9 | 19,663,976 | 5,353,776 |
| Burj Khalifa | 66 | 18,663,734 | 5,081,463 |
Outside the top 10 locations, 119 other active localities recorded rental activity with a combined transaction value of AED306,549,312. Examples from the next highest areas by value include Um Suqaim Second, Al Goze Third, and Marsa Dubai.
Registry records show that Unit properties accounted for 3,480 transactions valued at AED1,045,217,874. Labor Camps represented the largest value segment within this category at AED575,141,537 across 503 transactions, while Flat registrations reached 2,125 transactions valued at AED207,836,357.
Jabal Ali Industrial First recorded the highest locality value at AED495,929,799 from 308 transactions. Renewed agreements and Non Free Hold properties represented the largest transaction groups within their respective classifications.
Disclaimer
This report is based on publicly available market transaction summaries and compiled data related to Dubai real estate activity for the stated period.
Figures are presented for informational purposes only and may vary from final official statistics published by the Dubai Land Department (DLD).
1 US Dollar = 3.6725 UAE Dirhams
This material does not constitute financial or investment advice. Real estate investments involve risk and readers should conduct independent research before making any investment decisions.