Dubai Real Estate Rental Transactions: 11 June 2026
Dubai Real Estate Rental Transactions
11 June 2026
Dubai real estate rental transactions registered on 11 June 2026 totaled 4,388 contracts with a combined value of AED 2,810,374,804.
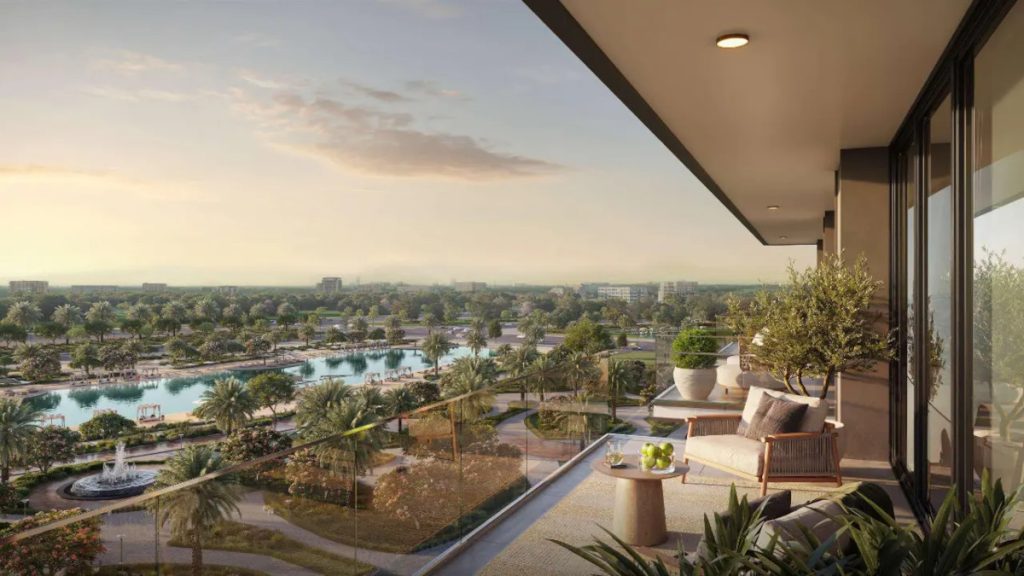
Riverton House Residences on the Lagoon in Meydan Horizon
Source: Building Arabia.
Rental Transactions by Contract Type
| Category | Number of Transactions | Value (AED) | Value (USD) |
|---|---|---|---|
| New | 1621 | 451,275,456 | 122,881,176.08 |
| Renewed | 2767 | 2,359,099,348 | 642,370,026.75 |
| Grand Total | 4388 | 2,810,374,804 | 765,251,202.83 |
Rental Transactions by Property Ownership
| Category | Number of Transactions | Value (AED) | Value (USD) |
|---|---|---|---|
| Free Hold | 2710 | 2,424,819,819 | 660,270,723.23 |
| Non Free Hold | 1678 | 385,554,985 | 104,980,479.60 |
| Grand Total | 4388 | 2,810,374,804 | 765,251,202.83 |
Rental Transactions by Property Usage
| Category | Number of Transactions | Value (AED) | Value (USD) |
|---|---|---|---|
| Commercial | 871 | 169,276,397 | 46,093,028.98 |
| Educational facility | 1 | 400,000 | 108,917.60 |
| Industrial | 18 | 136,471,301 | 37,170,951.10 |
| Residential | 3491 | 2,503,176,043 | 681,595,027.60 |
| Other | 7 | 1,051,063 | 286,200.70 |
| Grand Total | 4388 | 2,810,374,804 | 765,251,202.83 |
Rental Transactions by Property Type
| Category | Number of Transactions | Value (AED) | Value (USD) |
|---|---|---|---|
| A) Building | |||
| Factory | 2 | 1,520,000 | 413,886.88 |
| Subtotal | 2 | 1,520,000 | 413,886.88 |
| B) Land | |||
| Other | 2 | 136,063 | 37,058.45 |
| Subtotal | 2 | 136,063 | 37,058.45 |
| C) Unit | |||
| Flat | 2318 | 235,332,315 | 64,070,612.33 |
| GYM | 2 | 19,904,702 | 5,419,896.79 |
| Hotel | 17 | 3,569,750 | 972,015.42 |
| Kiosk | 2 | 118,900 | 32,375.76 |
| Labor Camps | 917 | 2,209,163,368 | 601,544,142.11 |
| Office | 391 | 56,538,656 | 15,391,959.50 |
| Open space | 1 | 500,000 | 136,147.00 |
| Penthouse | 1 | 240,000 | 65,350.56 |
| Shop | 238 | 62,477,689 | 17,008,574.65 |
| Showroom | 15 | 5,834,773 | 1,588,614.93 |
| Store | 1 | 55,000 | 14,976.17 |
| Studio | 30 | 1,096,392 | 298,527.70 |
| Warehouse | 63 | 144,857,057 | 39,444,792.21 |
| Workshop | 1 | 106,692 | 29,052.74 |
| Subtotal | 3997 | 2,739,795,293 | 745,996,041.87 |
| D) Villa | |||
| Complex Villas | 11 | 2,129,818 | 579,842.15 |
| Office | 1 | 700,000 | 190,605.80 |
| Villa | 224 | 57,170,640 | 15,567,769.19 |
| Subtotal | 236 | 60,000,458 | 16,338,217.14 |
| E) Virtual Unit | |||
| Office | 147 | 3,166,211 | 862,096.71 |
| Shop | 4 | 5,756,778 | 1,567,299.78 |
| Subtotal | 151 | 8,922,989 | 2,429,396.49 |
| Grand Total | 4388 | 2,810,374,804 | 765,251,202.83 |
Top 10 Localities by Value
| Category | Number of Transactions | Value (AED) | Value (USD) |
|---|---|---|---|
| Dubai Investment Park Second | 677 | 2,057,945,900 | 560,332,159.20 |
| Madinat Al Mataar | 25 | 133,882,966 | 36,447,564.91 |
| Dubai Investment Park First | 147 | 94,915,909 | 25,840,517.65 |
| Al Karama | 90 | 31,451,984 | 8,564,289.87 |
| Jabal Ali Industrial First | 92 | 26,358,785 | 7,176,966.72 |
| Al Goze Industrial Second | 53 | 25,362,246 | 6,905,532.74 |
| Al Raffa | 73 | 22,682,667 | 6,176,367.66 |
| Burj Khalifa | 81 | 21,875,461 | 5,956,666.90 |
| Business Bay | 171 | 21,667,393 | 5,899,997.23 |
| Al Thanyah Fifth | 77 | 21,134,416 | 5,754,996.16 |
Other active localities accounted for AED 355,097,843 (96,695,143.95 USD) across the remaining registered rental transactions.
Examples from the next highest recorded areas include Nad Al Shiba First, Al Warsan First, and Nadd Hessa.
Conclusion
Renewed contracts represented the larger share of daily rental value, while Free Hold properties carried most of the registered turnover.
The Unit category remained the main volume segment, led by Labor Camps, Flats, and Warehouse transactions.
Disclaimer
This report is based on publicly available market transaction summaries and compiled data related to Dubai real estate activity for the stated period.
Figures are presented for informational purposes only and may vary from final official statistics published by the Dubai Land Department (DLD).
1 US Dollar = 3.6725 UAE Dirhams
This material does not constitute financial or investment advice. Real estate investments involve risk and readers should conduct independent research before making any investment decisions.
Very ambitious project in the featured image
0.00 SBD,
0.06 STEEM,
0.06 SP