Dubai Real Estate Rental Transactions: 11 - 12 April 2026
Dubai Real Estate Rental Transactions Report
Weekend Summary — 11 to 12 April 2026
Dubai recorded 799 rental transactions during the weekend period of 11–12 April 2026, with a combined registered value of AED 76,008,870.
Renewed contracts exceeded new contracts by count and value. Residential use accounted for most transactions, while ownership value was closely split between Free Hold and Non Free Hold assets.
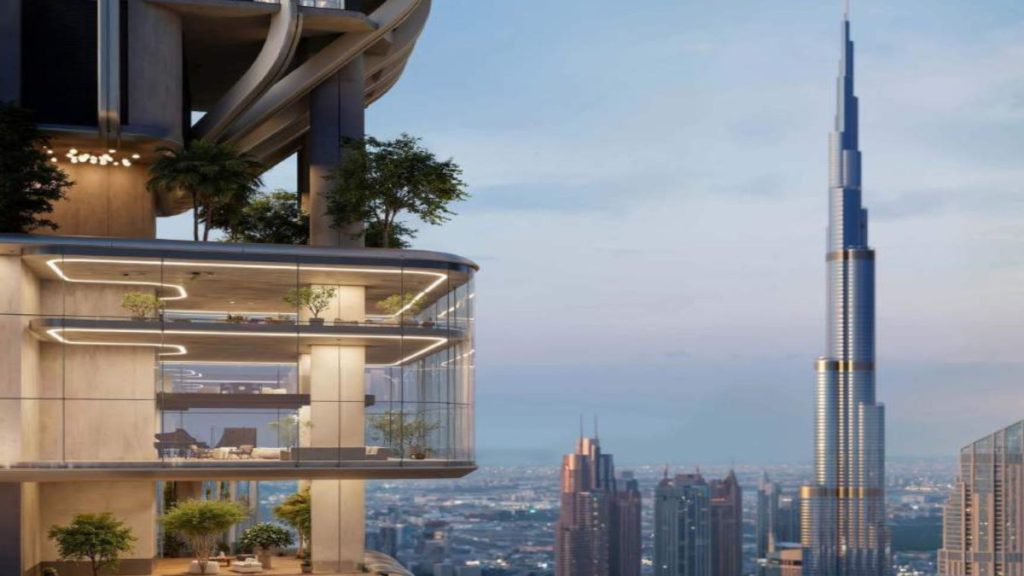
DWTN Residences, Downtown Dubai, UAE
Source: Building Arabia.
Transactions by Contract Type
| Category | Number of Transactions | Value (AED) | Value (USD) |
|---|---|---|---|
| New | 272 | 23,096,489 | 6,288,176 |
| Renewed | 527 | 52,912,381 | 14,407,343 |
| Grand Total | 799 | 76,008,870 | 20,695,519 |
Transactions by Property Ownership
| Category | Number of Transactions | Value (AED) | Value (USD) |
|---|---|---|---|
| Free Hold | 384 | 38,631,978 | 10,519,488 |
| Non Free Hold | 415 | 37,376,892 | 10,176,031 |
| Grand Total | 799 | 76,008,870 | 20,695,519 |
Transactions by Property Usage
| Category | Number of Transactions | Value (AED) | Value (USD) |
|---|---|---|---|
| Commercial | 163 | 23,374,477 | 6,364,857 |
| Residential | 636 | 52,634,393 | 14,330,662 |
| Grand Total | 799 | 76,008,870 | 20,695,519 |
Transactions by Property Type
| Category | Number of Transactions | Value (AED) | Value (USD) |
|---|---|---|---|
| A) Unit | 727 | 66,176,860 | 18,021,954 |
| Flat | 564 | 42,347,551 | 11,531,228 |
| Hotel | 14 | 1,631,250 | 444,189 |
| Labor Camps | 11 | 498,251 | 135,674 |
| Office | 71 | 4,066,223 | 1,107,230 |
| Parking | 1 | 94,380 | 25,700 |
| Shop | 53 | 16,569,269 | 4,512,111 |
| Studio | 9 | 361,580 | 98,466 |
| Warehouse | 4 | 608,355 | 165,855 |
| B) Villa | 52 | 9,427,010 | 2,567,375 |
| Complex Villas | 2 | 250,975 | 68,335 |
| Villa | 50 | 9,176,035 | 2,499,040 |
| C) Virtual Unit | 20 | 405,000 | 110,282 |
| Office | 20 | 405,000 | 110,282 |
| Grand Total | 799 | 76,008,870 | 20,695,519 |
Top 10 Localities by Value
| Category | Number of Transactions | Value (AED) | Value (USD) |
|---|---|---|---|
| Mirdif | 6 | 7,692,086 | 2,094,256 |
| Al Khairan First | 27 | 6,360,000 | 1,731,828 |
| Al Barsha First | 13 | 4,468,721 | 1,216,832 |
| Al Warqa First | 56 | 3,563,086 | 970,329 |
| Wadi Al Safa 5 | 16 | 2,611,853 | 711,008 |
| Business Bay | 21 | 2,308,889 | 628,911 |
| Marsa Dubai | 16 | 2,300,182 | 626,540 |
| Al Barsha South Fourth | 30 | 2,143,362 | 583,641 |
| Jabal Ali First | 29 | 2,128,772 | 579,668 |
| Al Murqabat | 19 | 1,956,926 | 532,871 |
The remaining 88 active localities recorded a combined value of AED 42,474,993. Next highest areas included Al Nahda Second, Burj Khalifa, and Al Karama.
Closing Summary
Weekend rental activity was led by renewed contracts and residential assets. Unit transactions accounted for the largest share of market volume, with flats representing the main subtype.
Mirdif recorded the highest locality value for the period, while Al Warqa First posted the largest transaction count among the leading areas.
Disclaimer
This report is based on publicly available market transaction summaries and compiled data related to Dubai real estate activity for the stated period.
Figures are presented for informational purposes only and may vary from final official statistics published by the Dubai Land Department (DLD).
1 US Dollar = 3.6725 UAE Dirhams
This material does not constitute financial or investment advice. Real estate investments involve risk and readers should conduct independent research before making any investment decisions.